
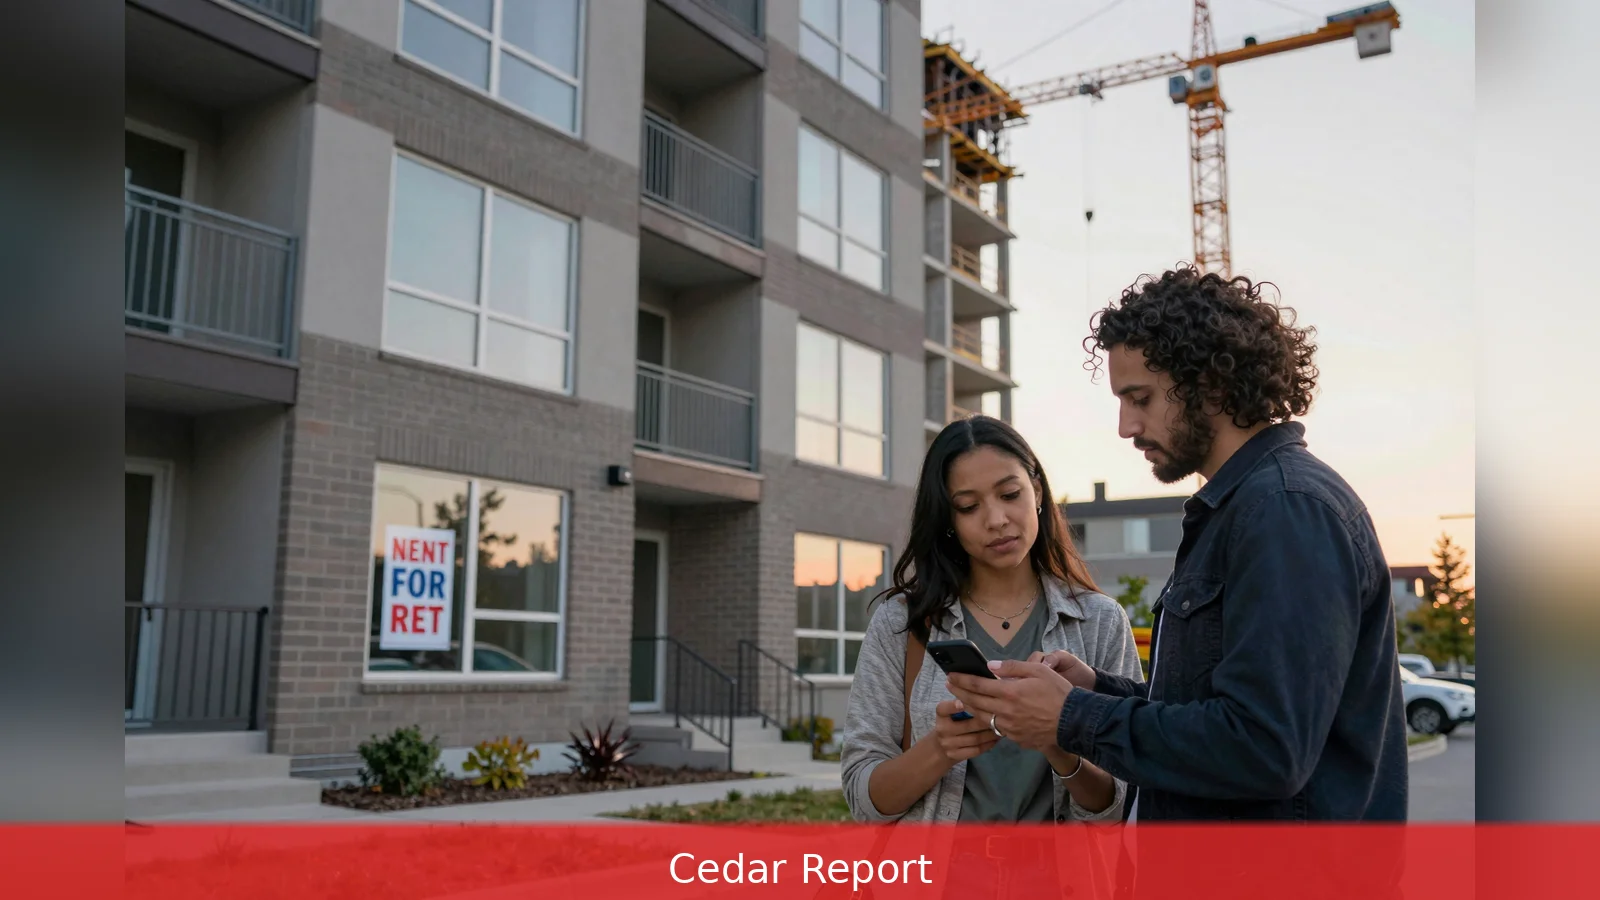
Treat $2,027 as your shopping yardstick, not a promise you'll find that price locally. Rentals.ca and Urbanation put the national average asking rent at $2,027 in April 2026, a 4.7 percent year-over-year decline and the 19th straight annual drop in their series, while liv.rent reports a 3.1 percent national vacancy rate and an 18 percent fall in immigration. That easing is real, but liv.rent also flags a sharp collapse in apartment starts and rising cancellations, warning that the reprieve could give way to renewed rental pressure by 2028 to 2030 if construction stays weak.
The national average of $2,027 suggests easing, yet provincial and metro data show meaningful divergence that will decide whether a listing is a bargain. Rentals.ca and Urbanation publish the headline national average, but the same datasets point to much larger declines in some markets and outright increases in others, so the number works as a frame rather than a rule.
1. Set a national benchmark before you shop
Start with the National benchmark of $2,027 from Rentals.ca and Urbanation. That figure, measured in April 2026, represents a 4.7 percent year-over-year decline and marks the 19th consecutive year-over-year decrease in their series. The pair report the headline average across both purpose-built apartments and condominium listings, and they break the segments out: purpose-built asking rents were about $2,027, down 3.7 percent year over year, while condominium asking rents sat at roughly $2,087, down 5.6 percent year over year.
Urbanation president Shaun Hildebrand put those trends in context when he said rents had fallen back to levels seen three years earlier, and that average asking rents were roughly $100 lower than a year before. In practice use $2,027 as a starting yardstick when you compare listings, but treat it as a broad benchmark rather than a guarantee of local pricing.
The national average masks wide provincial variation. Rentals.ca and Urbanation show the largest year-over-year drops in British Columbia and Ontario, with declines of about 5.9 percent and 5.2 percent respectively. By contrast, asking rents rose in Nova Scotia, Newfoundland and Labrador, Saskatchewan and Manitoba over the same period. That means what looks like a good deal in one province can be an overpriced listing in another.
Practical step for shoppers: fetch the most recent provincial and city tables from Rentals.ca or Urbanation and measure how your target market deviates from $2,027. If your city is in the provinces showing declines, you have more room to negotiate. If you are searching in a province where rents rose, expect to trade something else: location, size, or building age.
2. Compare unit types, size and incentives
Not all listings are created equal. Rentals.ca and Urbanation show condominium listings registered a steeper decline than purpose-built apartments, but condos and purpose-built units offer different amenities, maintenance profiles, and rules for incentives.
Smaller units can mean lower headline rent but higher price per square foot.
When comparing a $2,000 listing against the $2,027 benchmark, calculate price per square foot and note the building type. Ask whether the unit is a condo or purpose-built rental. For example, a 650 square foot condo listed at $1,900 is cheaper in absolute terms than a 900 square foot purpose-built unit at $2,100, but the condo may cost more per square foot and offer fewer long-term tenant protections. Use both absolute monthly cost and price per square foot in your comparisons.

Liv.rent's 2026 Rental Market Trend Report recorded a national Vacancy rate of 3.1 percent and documented a decline in immigration of 18 percent year over year. Those demand-side shifts helped push landlords to offer concessions and incentives, which directly affect the effective rent a tenant pays after accounting for one-off deals.
Always compare effective rent rather than sticker price. That means asking landlords whether advertised rents are negotiable and whether the listing includes incentives such as a free first month, rent credits, or lump-sum moving allowances. Where incentives are offered, calculate the effective monthly cost by spreading one-off concessions across the lease term. Then divide that monthly cost by the unit's square footage to get a comparable price per square foot. And get any incentive in writing so you can verify the comparison is apples-to-apples.
3. Time your search and prioritise tradeoffs
April's national decline masks a typical seasonal uptick. Rentals.ca and Urbanation recorded a 0.9 percent month-over-month increase in asking rents from March to April 2026, consistent with higher spring and summer demand. That means some of 2026's relief reflects longer-run easing, while month-to-month movement will still push modestly higher around peak listing seasons.
Put another way, you can sometimes find better deals outside the spring surge. If your move is flexible, consider searching in late fall or winter when demand tends to ease. But if you must lease in spring, expect modest upward pressure even in a year where the annual average is lower.
Your bargaining power depends on local market dynamics. Where Rentals.ca and Urbanation report larger declines, renters have more leverage. Where asking rents rose, flexibility will matter more. The shrinking average unit size also changes the tradeoffs: trading down square footage can lower absolute monthly rent even where price per square foot remains elevated.
Decide your priorities up front. If space is essential, accept you may pay more in tight metros. If location or building quality is negotiable, you can find below-average deals in markets with falling asking rents. Rank what matters to you, then apply the $2,027 benchmark and the local deviation to target realistic listings.
4. Watch construction, calculate effective rent, and refresh benchmarks
2026's relief has a structural risk attached. Liv.rent documented a pronounced fall in apartment starts in high-rise markets during 2025, including an 80 percent drop in Toronto apartment starts and a 7 percent drop in Vancouver starts compared with prior periods. The report also noted sharp rises in project cancellations between 2022 and 2024, describing fivefold and tenfold increases in cancelled units in Toronto and Vancouver respectively.
High-rise development takes years from start to occupancy, so a collapse in starts and a spike in cancellations today can translate into materially lower supply additions down the road. Liv.rent projects that if starts remain weak and cancellations persist, reduced new supply could create renewed rental tightening by 2028 to 2030. Treat the present easing as a temporary reprieve against a real medium-term supply risk.
Make comparisons simple and repeatable. First, calculate effective monthly rent when incentives are involved. Add the total of all one-time concessions to the sum of monthly payments over the lease term, then divide by the number of months. Example: if a landlord offers one free month on a 12-month lease with a $2,000 monthly sticker, the effective annual rent is (11 x 2,000) divided by 12, which equals about $1,833 per month.
Second, divide that effective monthly rent by the unit's square footage to get price per square foot. Using the example above for a 700 square foot unit, $1,833 divided by 700 gives about $2.62 per square foot. Compare that figure to the national average unit size of 827 square feet and to local market norms from Rentals.ca or Urbanation to decide whether the listing offers real value.
Both datasets matter because they emphasise complementary forces. Rentals.ca and Urbanation provide the current asking price picture and segment detail. Liv.rent offers a supply-side lens and a vacancy snapshot. Use both when you set search targets and refresh your benchmarks every quarter to capture seasonality and any meaningful shift in starts, cancellations, vacancy, or immigration.
Concretely: keep $2,027 in your set of tools as the national benchmark, but check the latest city or provincial table before you make an offer. Ask landlords about incentives and get terms in writing. And remember liv.rent's medium-term warning that a drop in construction starts and higher cancellations could pull the market back to tight conditions by 2028 to 2030 if those trends persist.
Related Articles
- Turn off AI in Google Docs in 5 steps
- Cut LLM API costs 50-90% with caching and routing
- 9 steps to make generative AI better for creatives
If starts remain weak and cancellations continue, liv.rent projects supply will lag demand and rents could tighten again by 2028 to 2030. Keep your search disciplined: refresh local benchmarks and recalculate effective rent each quarter before you sign.
This article was created with AI assistance.


